Data Science and Design Thinking Belong Together
With the proliferation and increased accessibility of automated and AI-enhanced data processing tools, many are racing to incorporate data science into their product design and delivery operations. However, in order to achieve the best product outcomes, it’s important to understand how qualitative and quantitative methods can complement and reinforce each other throughout the design process in order to achieve products that are both human-centered and robust. At frog, we are constantly iterating and experimenting with new ways of combining these methods to produce better products and services for our clients.
Many product design and delivery teams approach data science as a tool for automating and enhancing the mechanics of existing processes (e.g. automatic audio transcription of design research interviews, or computer vision and clustering of concept ideas). At frog, we say “Yes, and…” to this approach: Yes, we will use these mechanical assists as part of our everyday work, and we also believe that data science techniques can fundamentally enhance our understanding of our client’s challenges and our ability to develop robust, validated and scalable solutions to them. Data science not only allows us to interact with user data in new ways, but also provides the means to gather and analyze new types of user information, giving statistical power and validation to our designs. In the end, the marriage between data science and design thinking is all about understanding our end user, and in turn, how we can help our clients best serve that user.
Data-Enhanced Design Thinking
Design thinking is a structured approach to solving problems, consisting of various qualitative activities that support the generation of insightful, human-centered and impactful design solutions. The activities carried out during the design thinking process may vary from project to project depending on the nature of the problem at hand, but the core activities include:
— Empathize
— Define
— Ideate
— Prototype
— Test
At frog, we augment these qualitative activities with a number of quantitative methods that both validate the hypotheses that emerge during the design process, as well as provide new sources of insight. While many of these quantitative methods are necessarily carried out in parallel to the qualitative ones, we also make sure they intersect at key points of the design process. Some of the activities we list work better for “design research” projects, which place more emphasis on the stages of design thinking that uncover user needs and pain points, and prototype and validate potential solutions. Others work better for “design and build” projects, which place more emphasis on bringing these validated solutions into production and iteratively improving upon them.
Below, we outline the five stages in our human-centered product design and delivery process along with how data science intersects at each moment, and examples of activities that accompany each.
Stage 1: Empathize
Context: The first stage of the design thinking process is to build empathy with our users. From a qualitative perspective, this often involves conducting ethnographic interviews with relatively small groups of users in order to gain a deep understanding of the user journey and the pain points, motivations and consequent behaviors that are relevant to our design problem.
While secondary research using both proprietary and open source information helps determine the overarching structure of these interviews, we always seek to ask open-ended questions that might elicit unexpected and counter-intuitive responses. Such responses illuminate conclusions we would not have arrived at through a process of purely deductive reasoning, leading to key insights that can inform our later designs.
Need for Data Science: Data science as a field does not typically pay much attention to the process of empathy. At frog, however, we believe that the empathizing phase of the design thinking process is a critical juncture for the introduction of data science. By informing our qualitative research with quantitative insights, we can ensure that our own biases don’t lead us to place too much importance on the pain points of users whose stories resonate strongly with us, for example, or too little on those whose stories do not.
Example Activities: Social media communities provide valuable information and additional context to problems that our users are experiencing, and data science can help us put that information into perspective and weigh it against the results of design research. For example, quantitative surveying using well designed, conditionally structured questions helps us establish the presence and strength of statistically significant causal links between pain points, beliefs and consequent user behaviors. These surveys cannot be properly designed without first forming hypotheses on what these links might be; qualitative approaches tell us what may be happening and what the reasons may be, quantitative approaches tell us how frequently it is happening and how important those reasons are.
Stage 2: Define
Context: Having built empathy with our users and an understanding of the reasons for their behaviors, we then define the nature and extent of their problems more concretely. This process synthesizes all of the information we have learned so far by identifying patterns that either confirm or confound our expectations. Often, the key insights that emerge from this process combine some well understood theory of how the world works with unexpected findings from our design research.
The clear definition of user needs enables the formation of one or more hypotheses that serve as starting points for innovative designs that address those needs in new or unexpected ways. This process provides unique advantages to our clients, whose competitors tend to lean more heavily on perceived domain knowledge and have a relatively shallow understanding of their users.
Need for Data Science: Data science is a critical tool for evaluating the quality of the hypotheses we develop. If we have been systematic about our data acquisition and analysis in the Empathize stage, we can directly test our hypotheses against quantitative evidence to establish their comparative strengths and prioritize them accordingly in the Define stage. For example, if we know that a particular pain point was expressed very strongly in qualitative research but affects only 10 percent of users, while another was mentioned in passing but affects 90 percent of users, we can develop more useful hypotheses about which problems need to be solved first and how much effort will be required to solve them.
Moreover, by finding correlations between pain points and the types of users who experience them, we can develop even more nuanced hypotheses that only apply to certain user archetypes or in certain modes of behavior.
Example Activities: The Define stage is highly iterative, cycling between qualitative hypothesis formation, quantitative testing and validation, and hypothesis refinement. For example, we may have two hypotheses about why some users are not completing a sign-up process: either the sign-up takes too much time, or it requires information the users do not have on hand. In this case, quantitative methods such as AB testing can compare the time spent by users who completed the sign-up with the time spent by those who did not; or the completion rates of users who are using a laptop at home, where they can more easily locate a key piece of information, with those using a mobile device. We could go even further, comparing the time spent by users on mobile devices against those on laptops to tell us whether one of our hypotheses may be acting as a confounding factor instead of a causal factor.
Stage 3: Ideate
Context: In the Ideation stage we brainstorm potential solutions to our user pain points. We use the mantra “no idea is a bad idea” to encourage uninhibited ideation and generate solutions that may not be immediately obvious or typical given the sorts of problems we have identified. After the initial brainstorming, we down-select and sort the concepts into clusters that seem to fit together (e.g., they solve similar pain points, or are suitable for certain user archetypes or technologies).
Need for Data Science: At first glance, developing quantified analyses of various pain points and the strengths of our hypotheses may seem to run against Ideation’s need for unrestricted, open-ended possibilities. That’s why we largely set them aside during the brainstorming session, using them instead as a contextual frame to ensure we’re all starting from a common understanding of the problem space.
During the down-selection and concept sorting phase of Ideation, however, these quantitative understandings can play a vital role in intelligently clustering ideas, and serve as a tie-breaker when there are competing opinions about which approach might be best.
Example Activities: While there are some opportunities for process automation in the Ideation stage (e.g., automatic clustering of different ideas using natural language processing and unsupervised learning techniques), the primary benefit of data science in this stage is in the synthesis of user pain points, our hypotheses about their underlying causes and the concepts we have developed to solve them. Here we can use quantitative surveying, which has been made much easier and more powerful by interactive online testing platforms, to design and train a behavioral model that both measures the extent to which each concept addresses underlying pain points, and predicts how they will influence user behavior. Such a model can also be used to maximize the impact that we will get from any particular solution.
Stage 4: Prototype
Context: The Prototyping stage is when the concepts come to life. Visual designers sketch out mockup screens and product features. Interaction designers build user journeys, hero flows and interactive prototypes. Strategists develop business models and product roadmaps that will maximize product uptake and revenue. Prototypes undergo extensive iteration to ensure that they have fully addressed the pain points uncovered during research.
Need for Data Science: Prototyping’s specific data science needs will differ depending on the project, but data science should always inform the process. In design research projects it is critical that the prototypes being developed solve the most important problems, and in the right order. The behavioral model can be queried to ensure this is the case and to guide the improvement of the user journey. In design and build projects, we might leverage the behavioral model to ensure that the alpha version of the product does not experience usability issues due to lack of data, or that the product roadmap includes a targeted data acquisition strategy, enabling more sophisticated functionalities to be validated by user interactions before being deployed more widely.
Example Activities: In design research projects, it is important to make decisions about the relative value of different product features. The behavioral model can support this process by evaluating how much they address each pain point, as well as the total number of users they address by including the prevalence of each pain point in the market. It can also be used to eliminate redundancies by ensuring design solutions are as orthogonal as possible in terms of the pain points and users addressed by each product component.
In design and build projects, we are typically preparing for a small in-market test of our MVP. In these cases the behavioral model can help identify which users are most likely to engage with our product and provide useful active or passive feedback. It can also be used to evaluate which combination of features will best address the needs of these user groups. At this point we also develop the initial data acquisition pipelines and analytics components that will allow us to interpret user feedback in the context of what we have already learned about the users.
Stage 5: Test
Context: While a certain amount of concept testing takes place throughout the previous stages, Testing merits its own phase because it is the first time we get feedback from real users about how our design solutions address their needs. Despite our efforts to ensure that all user needs are addressed, testing may uncover mistakes we have made or opportunities we did not fully realize. Perhaps we did not consider one group sufficiently. Perhaps there was a pain point or user behavior that was not identified during our research, but which became apparent when people began to interact with the system.
In design research projects, we typically put sketches, physical prototypes or click-throughs into the hands of users and give them the opportunity to provide real-time verbal feedback about their experience. We use this feedback to learn where we need to change or refine our product features.
For design and build projects, the concept of a “test and learn” loop is useful to emphasize the iterative and ongoing nature of product refinement and improvement. A solution that is perfect on day one will not stay perfect forever–user needs and behaviors shift, and competitors may copy the most successful elements of our designs, forcing us to innovate and stay ahead of them.
Need for Data Science: While there are classes of models that work well for small groups of users given sufficient domain knowledge, all data science techniques work better at scale. Unless our design is only intended for a very small group of users, which is rarely the case, testing with the largest possible group of users gives us more confidence that our design will be successful in the marketplace. Data science provides us the means to measure and compare our designs in an unbiased way. This can be done at different levels of design fidelity and at different resolutions of our product, from the granular feature level all the way up to the level of the overarching system, depending on where we are in our design process and on the resources available for prototyping and testing design elements.
Example Activities: Deep qualitative feedback can only be gained in small focus groups. However, a degree of qualitative feedback can be gathered from larger user groups by being encoded into statistical tests. The results of these tests can then be incorporated into product backlogs to ensure the most effective use of our design and development resources, or probed even further in additional qualitative feedback sessions to uncover more insight into the causes of any unexpected trends, patterns and correlations we have discovered.
In design research projects, we rarely reach a finished product without testing concepts and features for viability. Quantitative surveying and online click-throughs can be used to test features, information layouts, design languages and user flows to uncover hidden problems and bottlenecks that may not be visible in a small group. We can also ask users about how their behavior might change if they used our product, or whether they would use our product at all, given their existing processes and workarounds. While this could bring bad news, it is better to hear this news early so we can course-correct and make more efficient interventions.
In design and build projects, when we will effectively put our design into production, we must be much more structured about how we test and learn. Analytics must be in place to measure and visualize not only traditional KPIs like conversion and click-through rates, but also user experience metrics that could traditionally only be measured in design lab conditions. More familiar methods like AB testing must be extended to test site layouts and features, as well as the very pain points and undesired behaviors which we have attempted to address in our design solution.
Getting it right
As illustrated above, data science can provide much more than purely mechanical interventions that merely supercharge the classical design thinking process, although such tools are undoubtedly useful. Additionally, there is no reason to put data science at odds with traditional qualitative approaches, or to engage in ideological wars over which approach is better. By carefully interweaving design thinking, strategy and data science, we believe we can achieve design solutions that are not only conceptually and experientially outstanding, but that will also succeed in the marketplace.

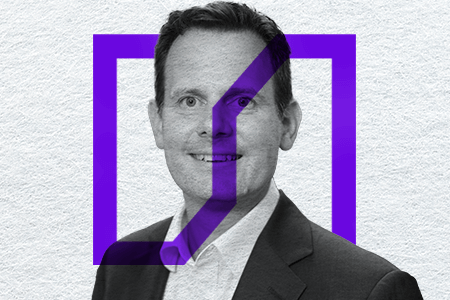
As frog’s Principal Director in Data Science, Vahndi guides clients to integrate data into the most challenging technical and design opportunities. Leading some of frog’s largest programs across the healthcare, finance and telecommunications industries, he has forged deep technical and management expertise leveraging data and machine learning to identify and develop innovative analytical solutions. Vahndi holds a Master’s degree in Data Science, is fluent in several languages (computer and natural), and has designed and built a number of data intensive systems.


We respect your privacy
We use Cookies to improve your experience on our website. They help us to improve site performance, present you relevant advertising and enable you to share content in social media. You may accept all Cookies, or choose to manage them individually. You can change your settings at any time by clicking Cookie Settings available in the footer of every page. For more information related to the Cookies, please visit our Cookie Policy.
Our Studios